Latest Updates
Showing posts with label volume. Show all posts

Arctic Sea Ice Steep Decline Continues


Steep decline of the Arctic sea ice continues. The yellow line on the image below follows 2014 sea ice area up to June 5 and shows that sea ice area now is close to a record low for the time of the year.

[ click on image to enlarge ]
The Naval Research Laboratory image below compares sea ice concentration on May 14, 2014 (left) with the sea ice concentration forecast for June 15, 2014 (run on June 7, 2014, on the right).


Above image shows falling sea ice concentration, with low sea ice concentration extending to the center of the Arctic Ocean.

Low sea ice concentration at the center of the Arctic Ocean is an ominous sign; at last year's minimum, very little sea ice was left close to the North Pole, as discussed in an earlier post.

On the right is an image of the University of Bremen showing sea ice concentration on June 8, 2014 (click on the images to enlarge them).

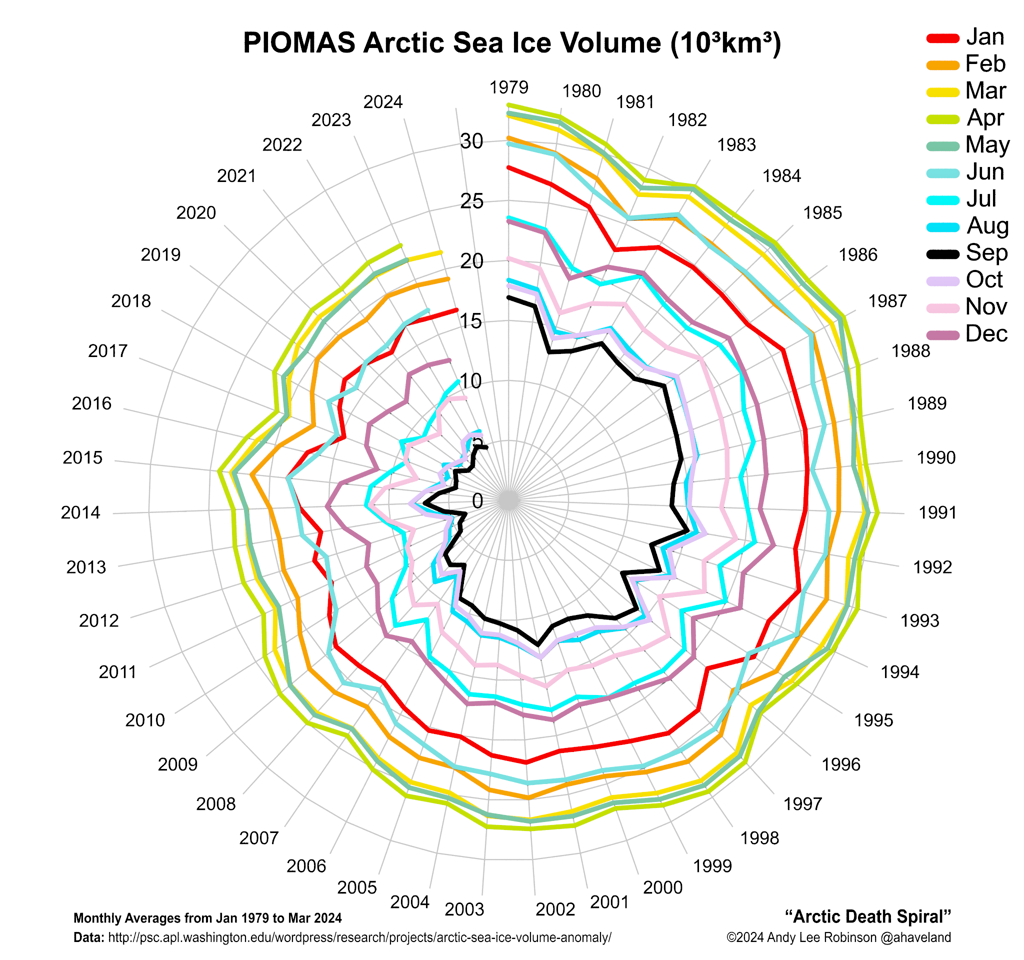
Arctic sea ice already is very thin, as discussed in recent posts. The image below shows that the sea ice volume trend down to zero was confirmed for the months April and May 2014.

[ image by Andy Lee Robinson based on PIOMAS data, click on image to enlarge ]
The lowest sea ice volume for 2014 is expected to be reached in September, and - given the shape the ice is in now - will likely be one of the lowest minima on record. In fact, there is a chance that there will be no ice left whatsoever later this year. As illustrated by the image by Wipneus below, an exponential curve based on annual minima from 1979 points at zero ice volume end 2016, with the lower limit of the 95% confidence interval pointing at zero ice end of 2014.
As the sea ice disappears, a lot more heat will be absorbed by the Arctic Ocean. Sea ice reflects 50% to 70% of the incoming energy, describes NSIDC.org, but thick sea ice covered with snow reflects as much as 90% of the incoming solar radiation. Melting of snow creates melt ponds on the ice and because shallow melt ponds have an albedo of approximately 0.2 to 0.4, the surface albedo drops to about 0.75. As melt ponds grow and deepen, the surface albedo can drop to 0.15. The ocean reflects only 6% of the incoming solar radiation and absorbs the rest. Snow and ice decline comes with a further feedback in that all the energy that during the melt went into transforming ice into water will - in the absence of ice - now be absorbed by the ocean as well.

Accelerated Warming in the Arctic

[ from the post Near-Term Human Extinction ]
Such feedbacks are causing warming to accelerate in the Arctic Ocean, as depicted in above image and described in the earlier post Feedbacks in the Arctic. Much of the Arctic Ocean is very shallow and the seafloor is thus vulnerable to warming. The Gulf Stream can be expected to keep carrying warmer water into the Arctic Ocean, so the situation is dire, while extreme weather events such as heatwaves and cyclones can make the situation even worse.

The NOAA image below shows huge sea surface temperature anomalies all over the Northern Hemisphere on June 8, 2014.

[ click on image to enlarge ]
Large areas with sea surface temperature anomalies up to 8°C and higher show up in and around the Arctic Ocean, as further illustrated by the image below.

[ click on image to enlarge ]
The image below shows high sea surface temperature anomalies from February 21, 2014, up to June 9, 2014, on the Northern Hemisphere (red bars), next to global average anomalies (orange/shaded bars).


The global sea surface temperature anomaly is worrying (a 1.25°C anomaly was reached on May 22, 2014). See the NOAA website to compare this with earlier months. Note that on specific spots the anomaly is much higher, as illustrated by the images further above.

Warm surface waters in the Arctic sea ice spell bad news, given that the sea ice is already at or close to record lows, in terms of area and volume.

And as ocean heat threatens to melt the sea ice from beneath, the sun is now strongly warming up the ice from above. Insolation in the Arctic is at its highest at this time of year, as Earth reaches its maximum axial tilt toward the sun of 23° 26'. In fact, insolation during the months June and July is higher in the Arctic than anywhere else on Earth, as discussed at this earlier post.

The diminishing temperature difference between the equator and the North Pole reduces the speed at which the Jet Stream circumnavigates Earth and it makes the Jet Stream become wavier, increasing opportunities for cold air to escape from the Arctic and for warm air to move in. More extreme weather increases the chance of intense and prolonged heatwaves and fierce cyclones, storms and winds to hit the Arctic Ocean.

Making things even worsen, there is the prospect of an El Niño event, projected to occur later this year. According to NOAA (June 5, 2014), the chance of El Niño is 70% during the Northern Hemisphere summer and reaches 80% during the fall and winter. El Niño odds are even higher than this, according to this post at the Wunderground blog.


Methane

Temperature rises of the water close to the seafloor of the Arctic Ocean are very dangerous, as heat can penetrate sediments and cause hydrate destabilization. Huge amounts of methane are held in sediments at the seafloor, in the form of free gas and hydrates. In shallow waters, methane released from the seafloor can more easily enter the atmosphere without getting broken down by microbes in the water.

Methane levels are already very high. On June 6, 2014, mean global methane reached levels as high as 1809 ppb, with peaks as high as 2516 ppb.

Methane release from the seafloor of the Arctic Ocean will warm up the Arctic even further, triggering even more methane releases, heatwaves, wildfires and further feedbacks, in a spiral of runaway warming, threatening to cause starvation, destruction and extintion at massive scale across the globe.


Earthquakes

Earthquakes are a further worry. A huge amount of melting takes place in Greenland, as described in the post Ten Cubic Kilometers of Ice Lost From Jakobshavn Glacier in Less than One Month. As the ice disappears, a large weight is lefted from Greenland, causing the Earth's crust there to be lifted in a phenomenon referred to as isostatic rebound. This can cause earthquakes to occur on the seafloor of the waters around Greenland, as illustrated by the image below.

[ click on image to enlarge ]

As the image below shows, the faultline alongside Greenland crosses the Arctic Ocean and extends into the Laptev Sea and Siberia, an area recently hit by two large earthquakes.

[ click on image to enlarge ]
Earthquakes in this region are very worrying. Earthquakes can trigger further earthquakes, especially at locations closeby on the same faultline. Earthquakes and subsequent shockwaves and landslides can further contribute to destabilization of methane hydrates contained in sediments under the seafloor of the Arctic Ocean.

In conclusion, the situation is dire and calls for comprehensive and effective action, as discussed at the climate plan blog.


Related

- M4.4 Earthquake hits Arctic Ocean north of Greenland
http://arctic-news.blogspot.com/2014/04/m45-earthquake-hits-arctic-ocean.html

- M4.5 Earthquake hits Arctic Ocean
http://arctic-news.blogspot.com/2014/04/m45-earthquake-hits-arctic-ocean.html

- Earthquakes in the Arctic Ocean
http://arctic-news.blogspot.com/2014/04/earthquakes-in-the-arctic-ocean.html

- Methane, Faults and Sea Ice
http://arctic-news.blogspot.com/2013/11/methane-faults-and-sea-ice.html

- Norwegian Sea hit by 4.6M Earthquake
http://arctic-news.blogspot.com/2013/11/norwegian-sea-hit-by-46m-earthquake.html

- Greenland Sea hit by M5.3 Earthquake
http://arctic-news.blogspot.com/2013/10/greenland-sea-hit-by-m53-earthquake.html

- Earthquake hits waters off Japan
http://arctic-news.blogspot.com/2013/10/earthquake-hits-waters-off-japan.html

- Earthquake hits Laptev Sea
http://arctic-news.blogspot.com/2013/09/earthquake-hits-laptev-sea.html

- Methane Release caused by Earthquakes
http://arctic-news.blogspot.com/2013/09/methane-release-caused-by-earthquakes.html

- Earthquake M6.7 hits Sea of Okhotsk
http://methane-hydrates.blogspot.com/2013/10/earthquake-m67-hits-sea-of-okhotsk.html

- Sea of Okhotsk
http://methane-hydrates.blogspot.com/2013/06/sea-of-okhotsk.html

- Seismic activity
http://arctic-news.blogspot.com/p/seismic-activity.html

- Climate Plan
http://climateplan.blogspot.com

Outlook for sea ice remains bleak


In April 2014, Arctic sea ice reached its annual maximum volume. It was the second lowest on record, according to calculations by the Pan-Arctic Ice Ocean Modeling and Assimilation System (PIOMAS) at the Polar Science Center. The ice volume in March 2014 also was the second lowest on record, as discussed in an earlier post. The fall in volume over the years is illustrated in the graph below, by Wipneus.
Another way of depicting the continuing fall in sea ice volume is the Arctic Death Spiral below, by Andy Lee Robinson.

The graph below, from the Danish Metereological Institute, shows mean temperatures that have been much higher than they used to be at higher latitudes. Mean 2 m temperatures for the region north of the 80th northern parallel as a function of the day of year are shown (red line), against the 1958 - 2002 mean (green line).


High levels of methane over the Arctic will have contributed to these high temperatures. Furthermore, the Jet Stream is changing as the difference in temperature between the Arctic and the equator decreases, causing more extreme weather events such as heatwaves and storms that could speed up the demise of snow and ice cover in the Arctic.

The graph below, by the Japan Aerospace Exploration Agency, shows that Arctic sea ice extent was 12,469,546 km² on May 8, 2014.

In addition, an El Niño event could cause even more ferocious heatwaves and storms to hit the Arctic. The image below, from IRI at Columbia University, shows that the chance of an El Niño event developing in the course of 2014 is close to 80%.


The outlook for the sea ice remains bleak and the possibility that a total collapse could occur in September calls for comprehensive and effective action, as discussed at the climate plan blog.


Arctic Sea Ice in Steep Descent

Arctic sea ice area is in steep descent, as illustrated by the image below. Sea ice area was only smaller at this time of the year in 2007, for all years for which satellite data are available.

[ click on image to enlarge ]
Earlier this year, on March 9, 2014, Arctic sea ice area was at a record low for the time of the year. Since then, area did show some growth for a while, to the north of Scandinavia. This growth could be attributed largely to strong winds that made the sea ice spread with little or no growth in volume. The 30-day Naval Research Laboratory animation below shows recent sea ice speed and drift.


Indeed, sea ice volume in March 2014 was the 2nd lowest on record. Only March 2011 had a lower volume as discussed in a recent post. The 30-day Naval Research Laboratory animation below shows recent sea ice thickness. 


Low sea ice volume and area jointly suggest there could be a total collapse of the sea ice later this year, in line with observation-based non-linear trends. For years, this blog has warned that observation-based projections point at Arctic sea ice disappearance within years, with dire consequences for the Arctic and for the world at large.

As said, winds are responsible for much of sea ice variability, and winds could either slow down or speed up such a collapse. On this point, it's good to remember what Prof. Peter Wadhams said in 2012:
". . apart from melting, strong winds can also influence sea ice extent, as happened in 2007 when much ice was driven across the Arctic Ocean by southerly winds. The fact that this occurred can only lead us to conclude that this could happen again. Natural variability offers no reason to rule out such a collapse, since natural variability works both ways, it could bring about such a collapse either earlier or later than models indicate.

In fact, the thinner the sea ice gets, the more likely an early collapse is to occur. It is accepted science that global warming will increase the intensity of extreme weather events, so more heavy winds and more intense storms can be expected to increasingly break up the remaining ice, both mechanically and by enhancing ocean heat transfer to the under-ice surface."
The image on the right, produced with NOAA data, shows mean coastal sea surface temperatures of over 10°C (50°F) in some areas in the Arctic on August 22, 2007.

In shallow waters, heat can more easily reach the bottom of the sea. In 2007, strong polynya activity caused more summertime open water in the Laptev Sea, in turn causing more vertical mixing of the water column during storms in late 2007, found a 2011 study, and bottom water temperatures on the mid-shelf increased by more than 3°C (5.4°F) compared to the long-term mean.

Another study found that drastic sea ice shrinkage causes increase in storm activities and deepening of the wind-wave-mixing layer down to depth ~50 m (164 ft) that enhance methane release from the water column to the atmosphere. Indeed, the danger is that heat will warm up sediments under the sea, containing methane in hydrates and as free gas, causing large amounts of this methane to escape rather abruptly into the atmosphere.

Such warming would come on top of ever-warmer water that is carried by the Gulf Stream into the Arctic Ocean and that has already been blamed for large methane releases from the seafloor of the Arctic Ocean last year.

The prospect of an El Niño event, as discussed in an earlier post, makes the situation even more dire.

The consequences of sea ice collapse will be devastating, as all the heat that previously went into transforming ice into water will be asbsorbed by even darker water, from where less sunlight will be reflected back into space. The danger is that further warming of the Arctic Ocean will trigger massive methane releases that could lead to extinction at massive sclae, including extinction of humans.

Hopefully, more people will realize the urgency of the situation and support calls for comprehensive and effective action as discussed at the Climate Plan blog.


Links

- March 2014 Arctic Sea Ice Volume 2nd Lowest On Record
http://arctic-news.blogspot.com/2014/04/march-2014-arctic-sea-ice-volume-2nd-lowest-on-record.html

- Supplementary Evidence by Professor Peter Wadhams
http://arctic-news.blogspot.com/2012/04/supplementary-evidence-by-prof-peter.html

- Has the Descent begun?
http://arctic-news.blogspot.com/2014/03/has-the-descent-begun.html

- Nea-term Human Extinction
http://arctic-news.blogspot.com/2014/04/near-term-human-extinction.html

- Climate Plan blog
http://climateplan.blogspot.com


March 2014 Arctic Sea Ice Volume 2nd lowest on Record

The March 2014 Arctic sea ice volume, as calculated by the Pan-Arctic Ice Ocean Modeling and Assimilation System (PIOMAS) at the Polar Science Center, was the 2nd lowest on record at 21.818 km³. Only March 2011 had a lower volume, at 21.421 km³, as illustrated by the graph below, by Wipneus.
Another way of depicting the continued fall of the sea ice volume is the Arctic Death Spiral below, by Andy Lee Robinson.

This puts the sea ice in a very weak position. This month, the sea ice will reach its highest volume, which may well be the lowest volume on record for April. The Naval Reserach Laboratory 30-day animation below shows recent sea ice thickness.


The lowest sea ice volume for 2014 is expected to be reached in September, and - given the shape the ice is in now - will likely be one of the lowest minima on record. In fact, there is a chance that there will be no ice left whatsoever later this year. As illustrated by the image below, again by Wipneus, an exponential curve based on annual minima from 1979 points at zero ice volume end 2016, with the lower limit of the 95% confidence interval pointing at zero ice end of 2014.
Absence of sea ice will mean that a lot of more heat will be absorbed by the Arctic Ocean.

As NSIDC.org describes, sea ice reflects 50% to 70% of the incoming energy, but thick sea ice covered with snow reflects as much as 90% of the incoming solar radiation. After the snow begins to melt, and because shallow melt ponds have an albedo of approximately 0.2 to 0.4, the surface albedo drops to about 0.75. As melt ponds grow and deepen, the surface albedo can drop to 0.15. The ocean reflects only 6% of the incoming solar radiation and absorbs the rest. Furthermore, all the heat that during the melt went into transforming ice into water will - in the absence of ice - be absorbed by the ocean as well.


Such feedbacks are causing warming to accelerate in the Arctic Ocean, much of which is very shallow and thus vulnerable to warming. The Gulf Stream can be expected to keep carrying warmer water into the Arctic Ocean. Extreme weather events such as heatwaves and cyclones could make the situation a lot worse.

Warming of the Arctic Ocean threatens to destabilize huge amounts of methane held in sediments at the seafloor, in the form of free gas and hydrates. The danger is that release of methane from the seafloor of the Arctic Ocean will warm up the Arctic even further, triggering even more methane releases, as well as heatwaves, wildfires and further feedbacks, in a spiral of runaway warming that will lead to starvation, destruction and extintion at massive scale across the globe.

In conclusion, the situation is dire and calls for comprehensive and effective action, as discussed at the climate plan blog.


M4.5 Earthquake hits Gakkel Ridge


The above image shows recent large methane release over the Gakkel Ridge, the faultline that crosses the Arctic Ocean between the northern tip of Greenland and the Laptev Sea (red line on map). Methane readings were as high as 2395 ppb at 586 mb, an altitude that often shows high methane readings originating from the Arctic Ocean.

An earthquake with a magnitude of 4.5 hit the Gakkel Ridge at a depth of 2 km on March 6, 2014, at 11:17.17.0 UTC. The location is shown on the map below.

[ click on image to enlarge ]
The image below shows more recent methane readings, around March 8, 2014.


The image below is a Naval Research Laboratory forecast of sea ice thickness for March 8, 2014, run on March 3, 2014.


Meanwhile, the sea ice is close to record lows (for the time of the year), as illustrated by the images below. The image directly below shows sea ice area.


The image below shows sea ice extent.


The image below, by Wipneus, shows sea ice volume.
The image below, by Andy Lee Robinson, offers a different way of looking at sea ice volume, the Arctic Death Spiral.